Want to know which stock to trade next week, click Subscriber Almanac.
How it Works
As you scroll this page, you will learn how to evaluate chart indicators professionally by the art of comparison.
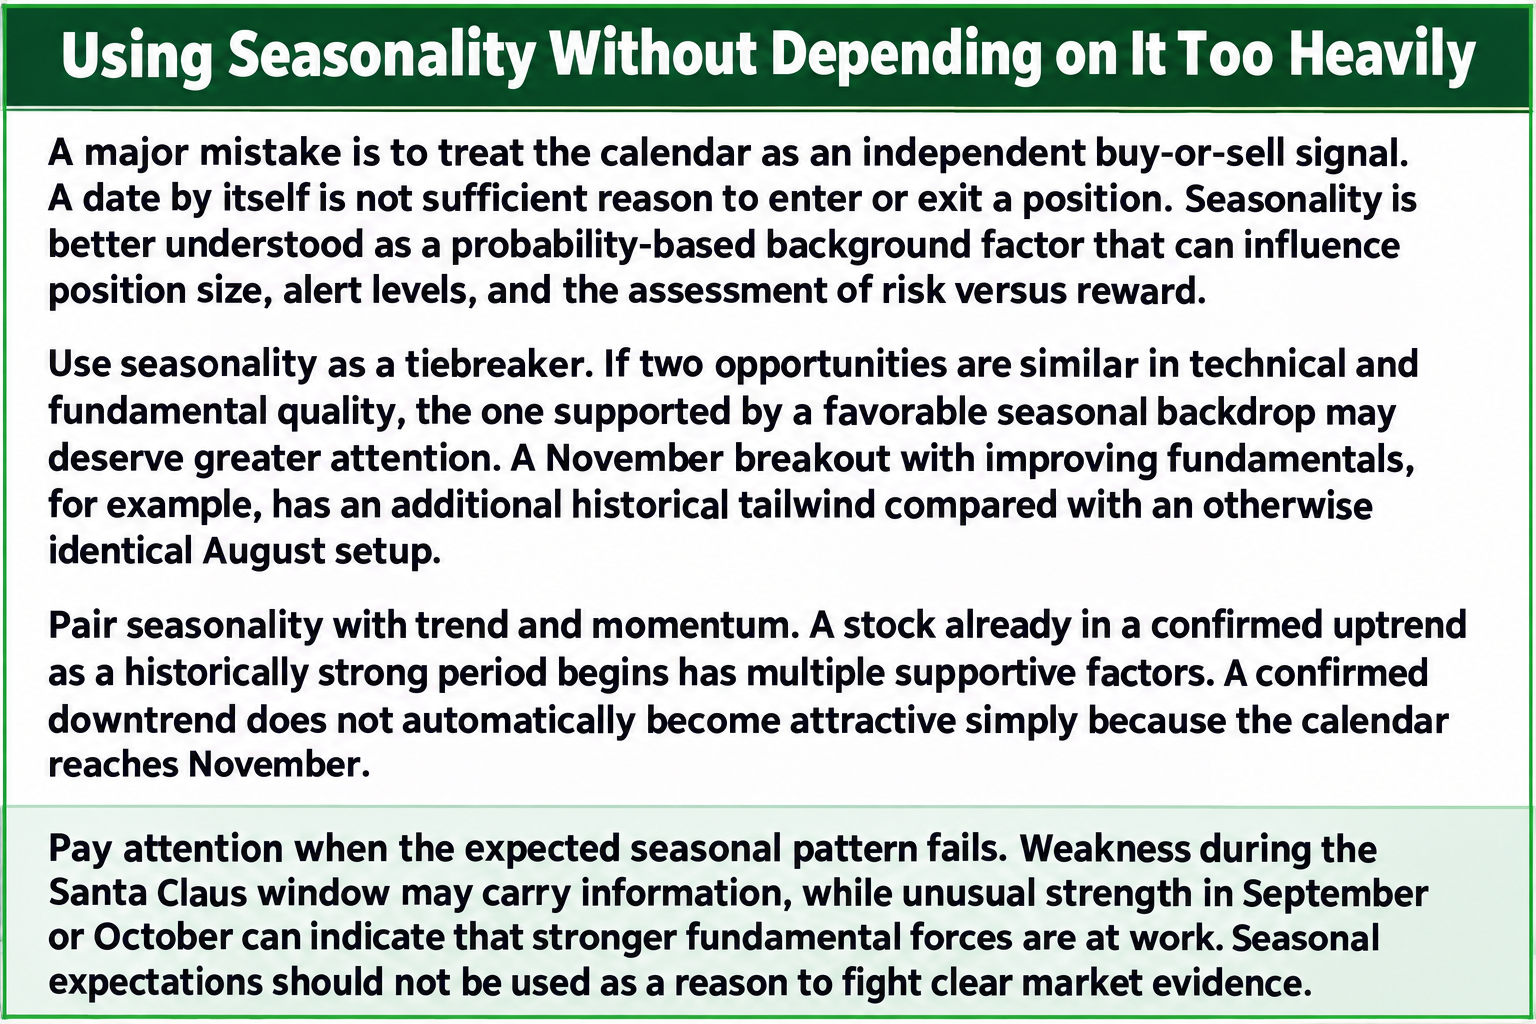
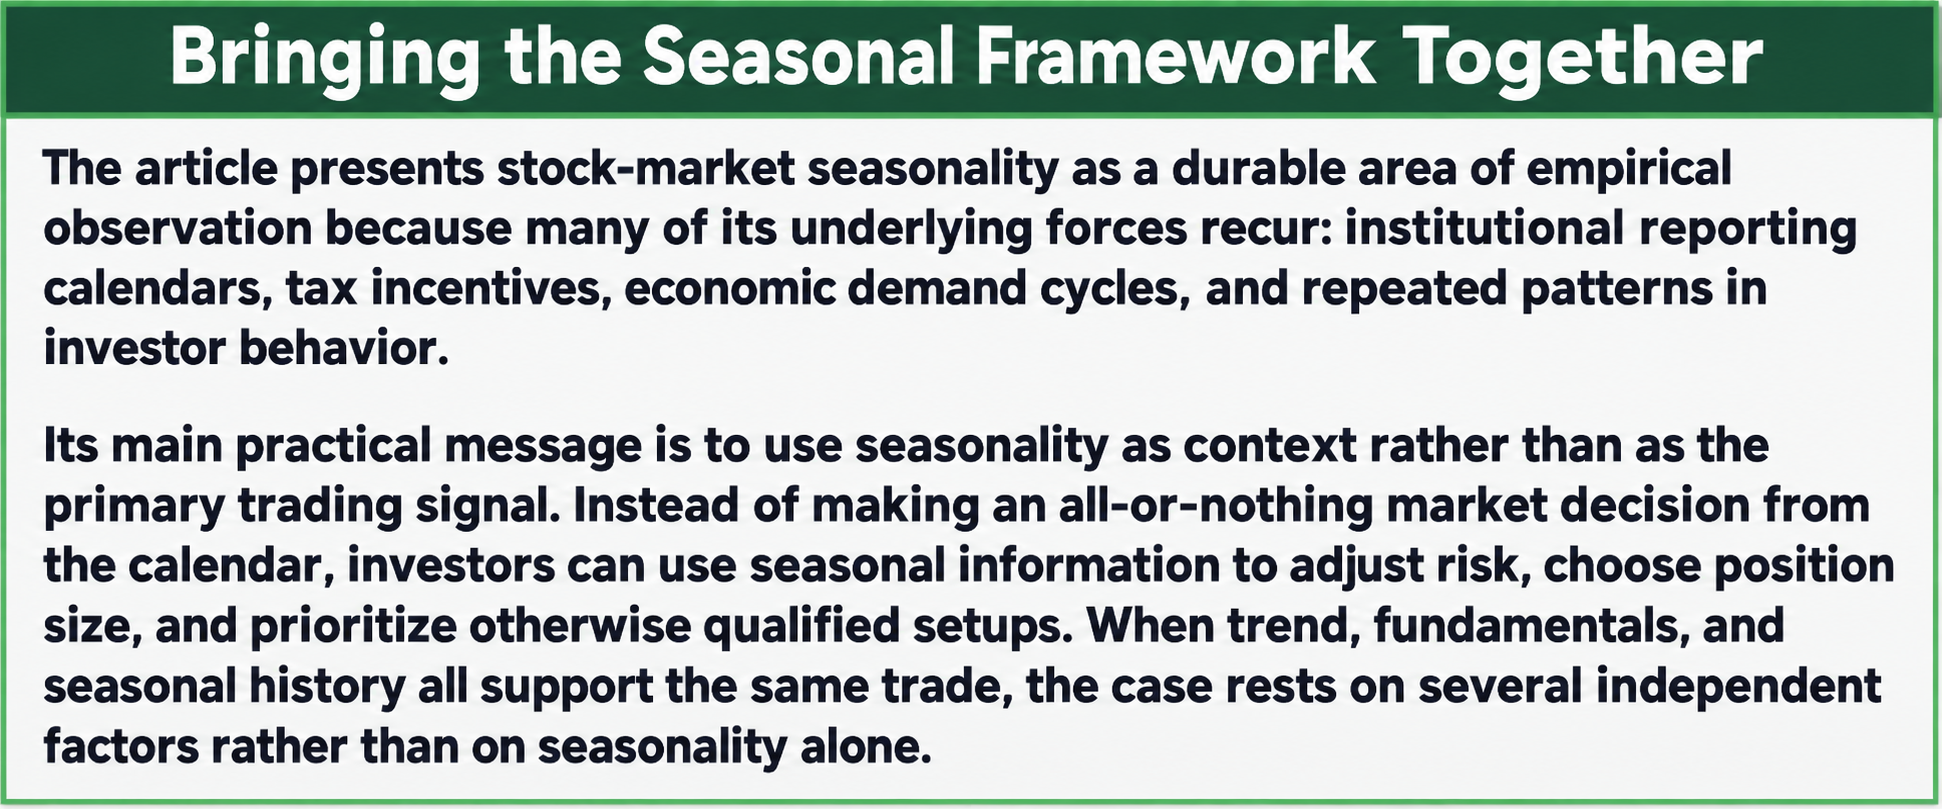
“Each month, we study historical seasonal patterns and identify stocks that have shown recurring strength during that period.”
Happy Trading!
“We then monitor trend, volume, momentum, valuation, and upcoming events. The information is educational only—not financial advice.”

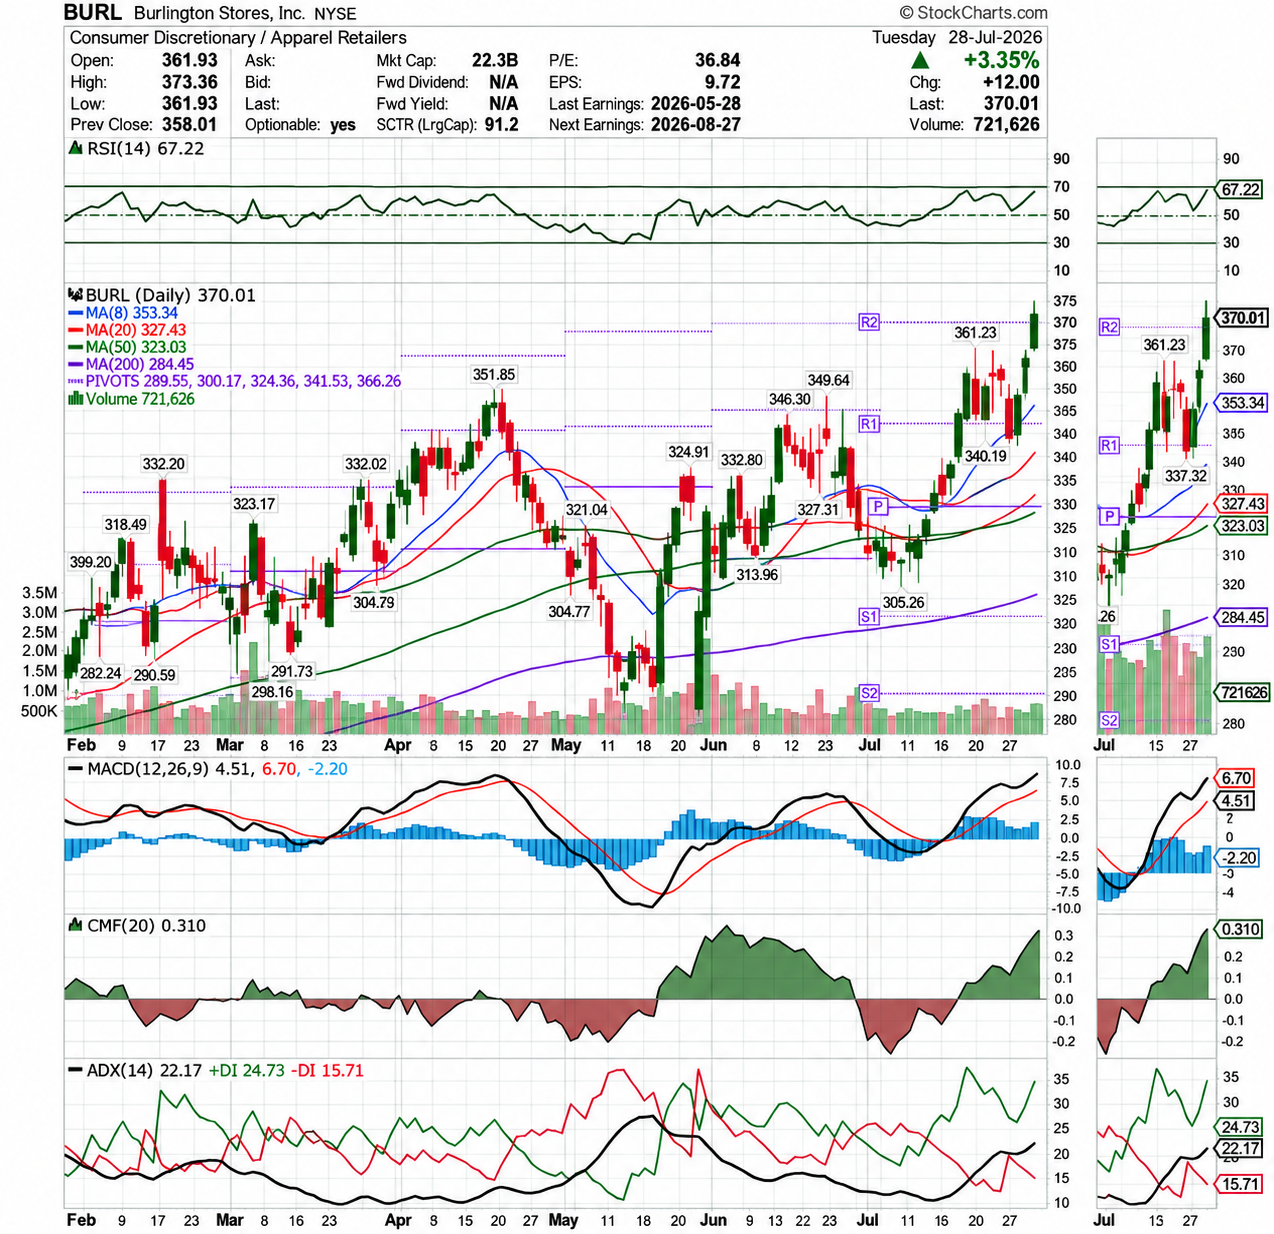
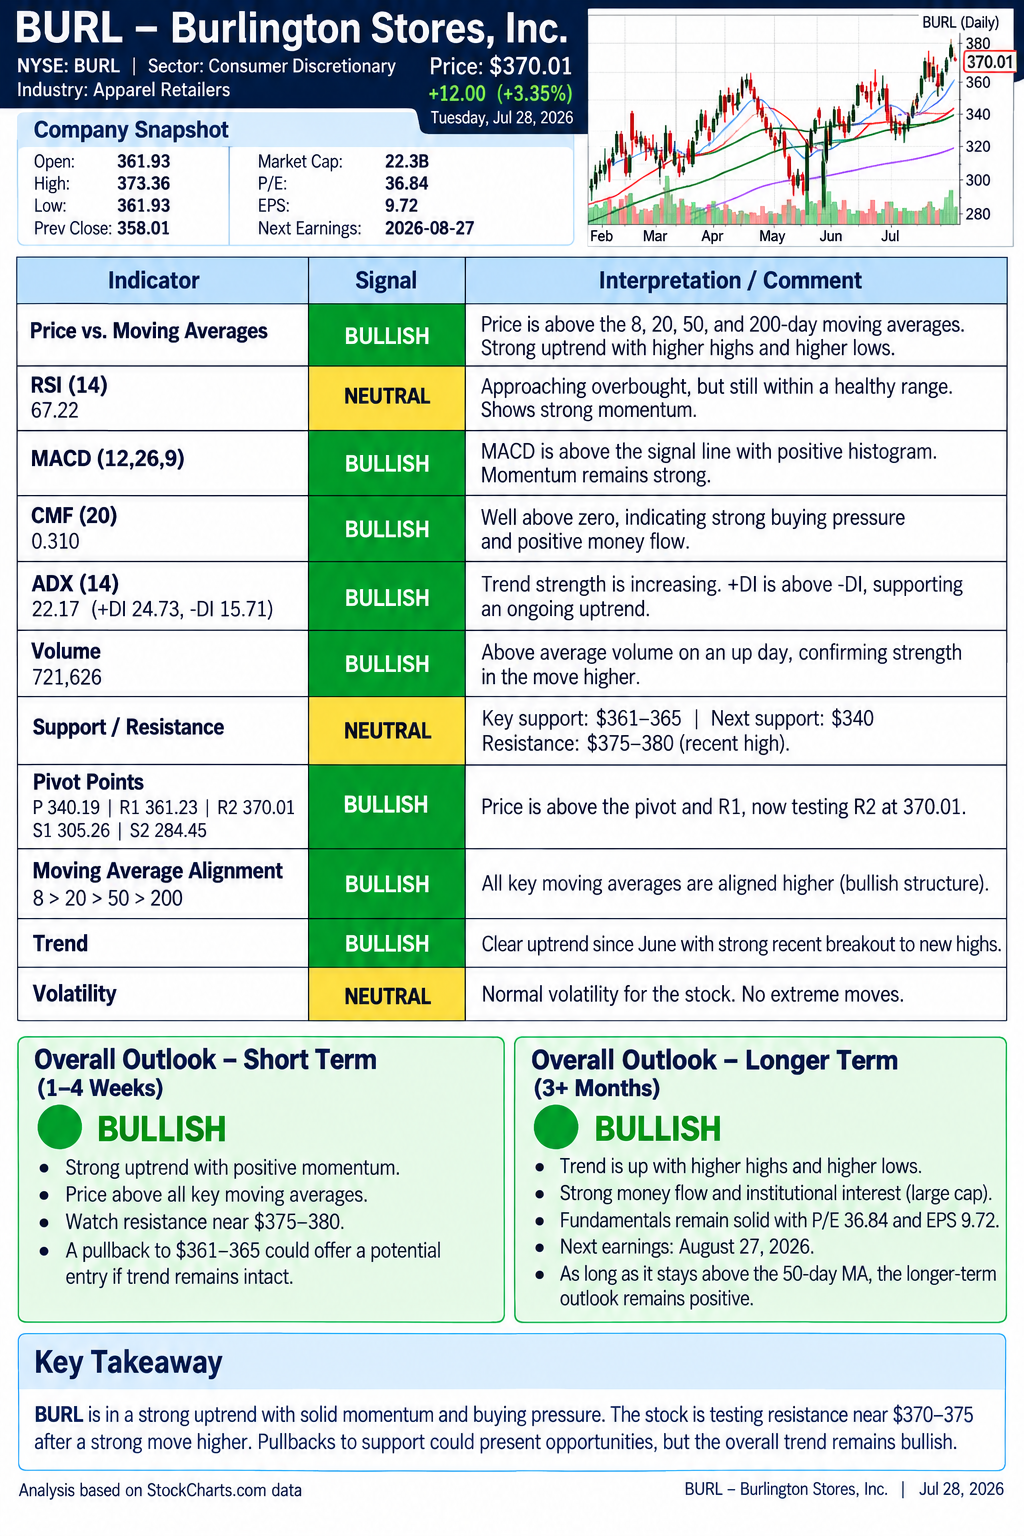
This chart illustrates a potential monthly watchlist candidate. At the time of the chart, the stock was trading near $370.01, with price above key moving averages, positive momentum, and supporting volume. These indicators RSI, MACD, CMF, ADX aligned to create a possible bullish setup for further confirmation—not a guaranteed trade. However, actionable and tradeable.